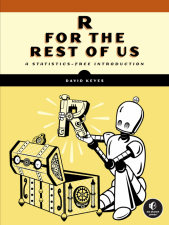
R for the Rest of Us Cover

R for the Rest of Us

A Statistics-Free Introduction
by David Keyes
May 2024, 256 pp.
ISBN-13: 
9781718503328

Download Chapter 2: Principles of Data Visualization

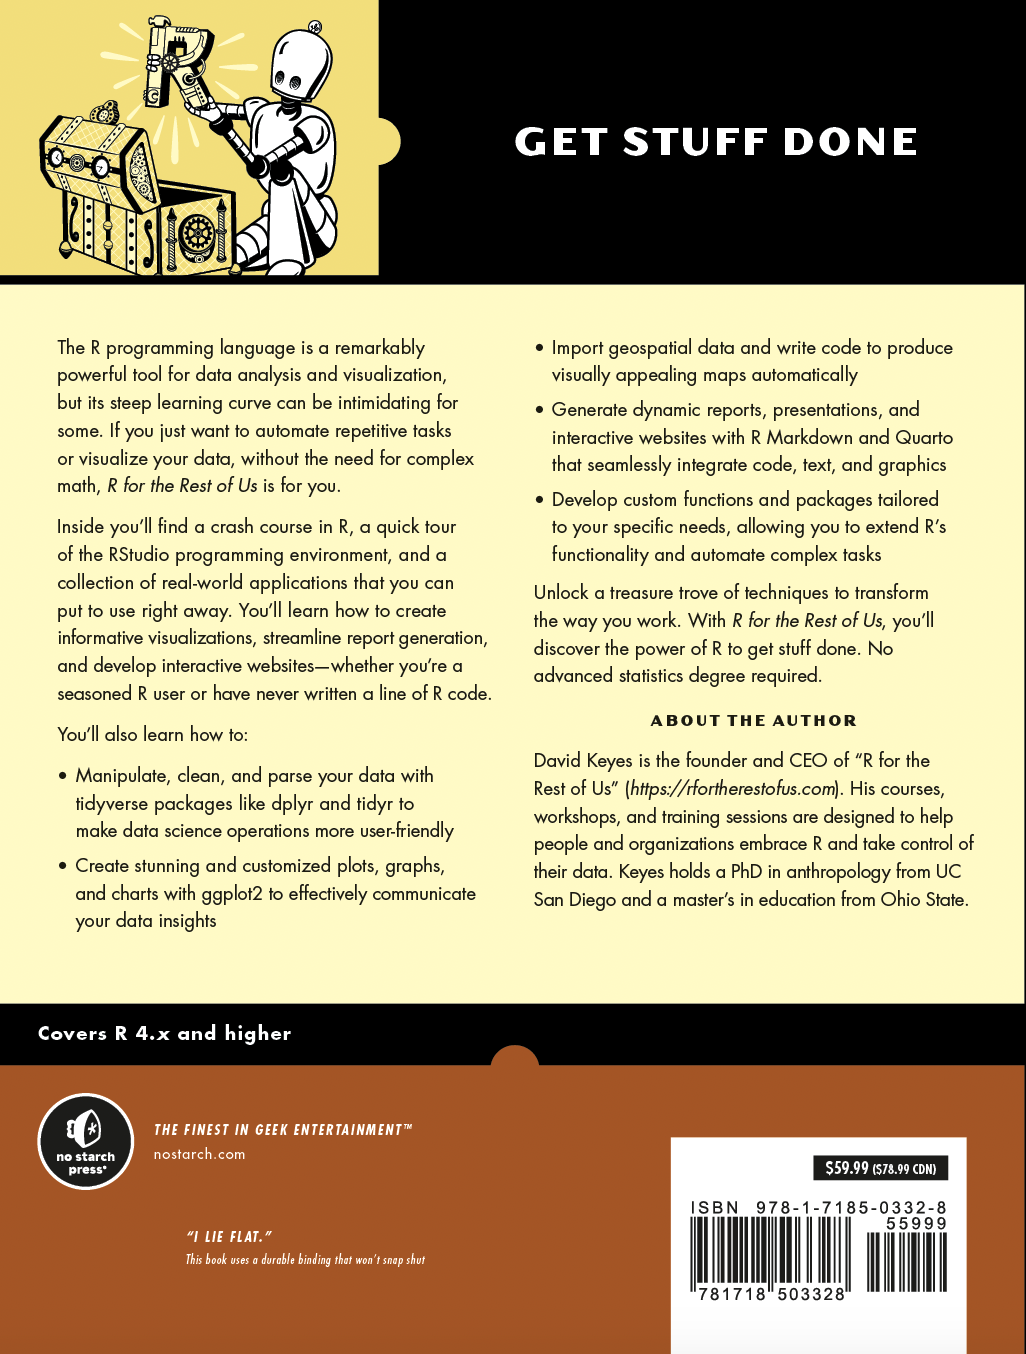
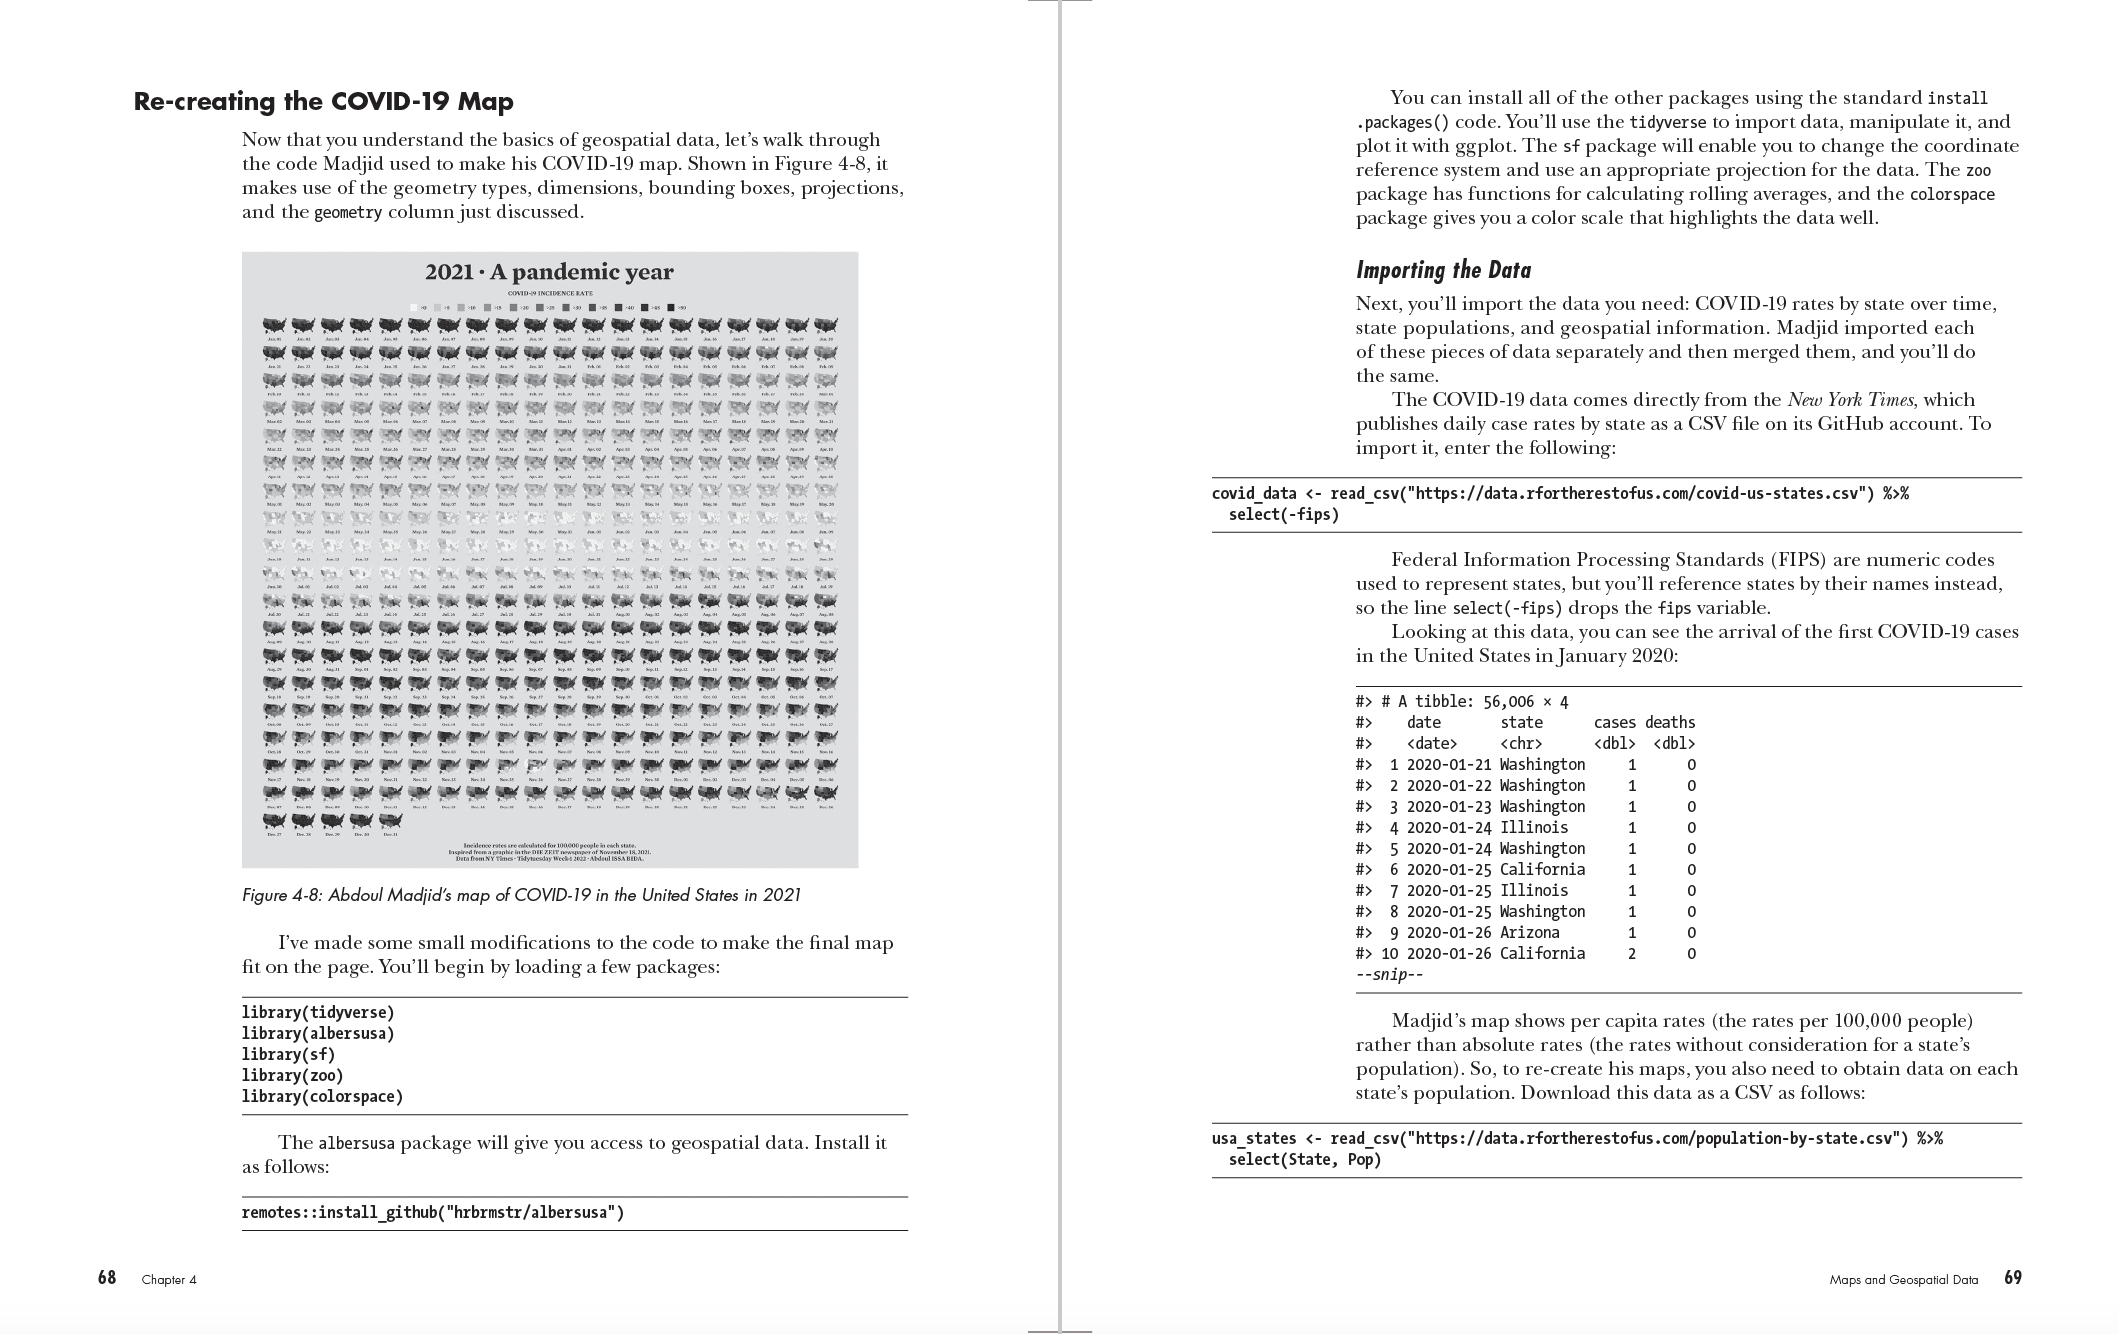
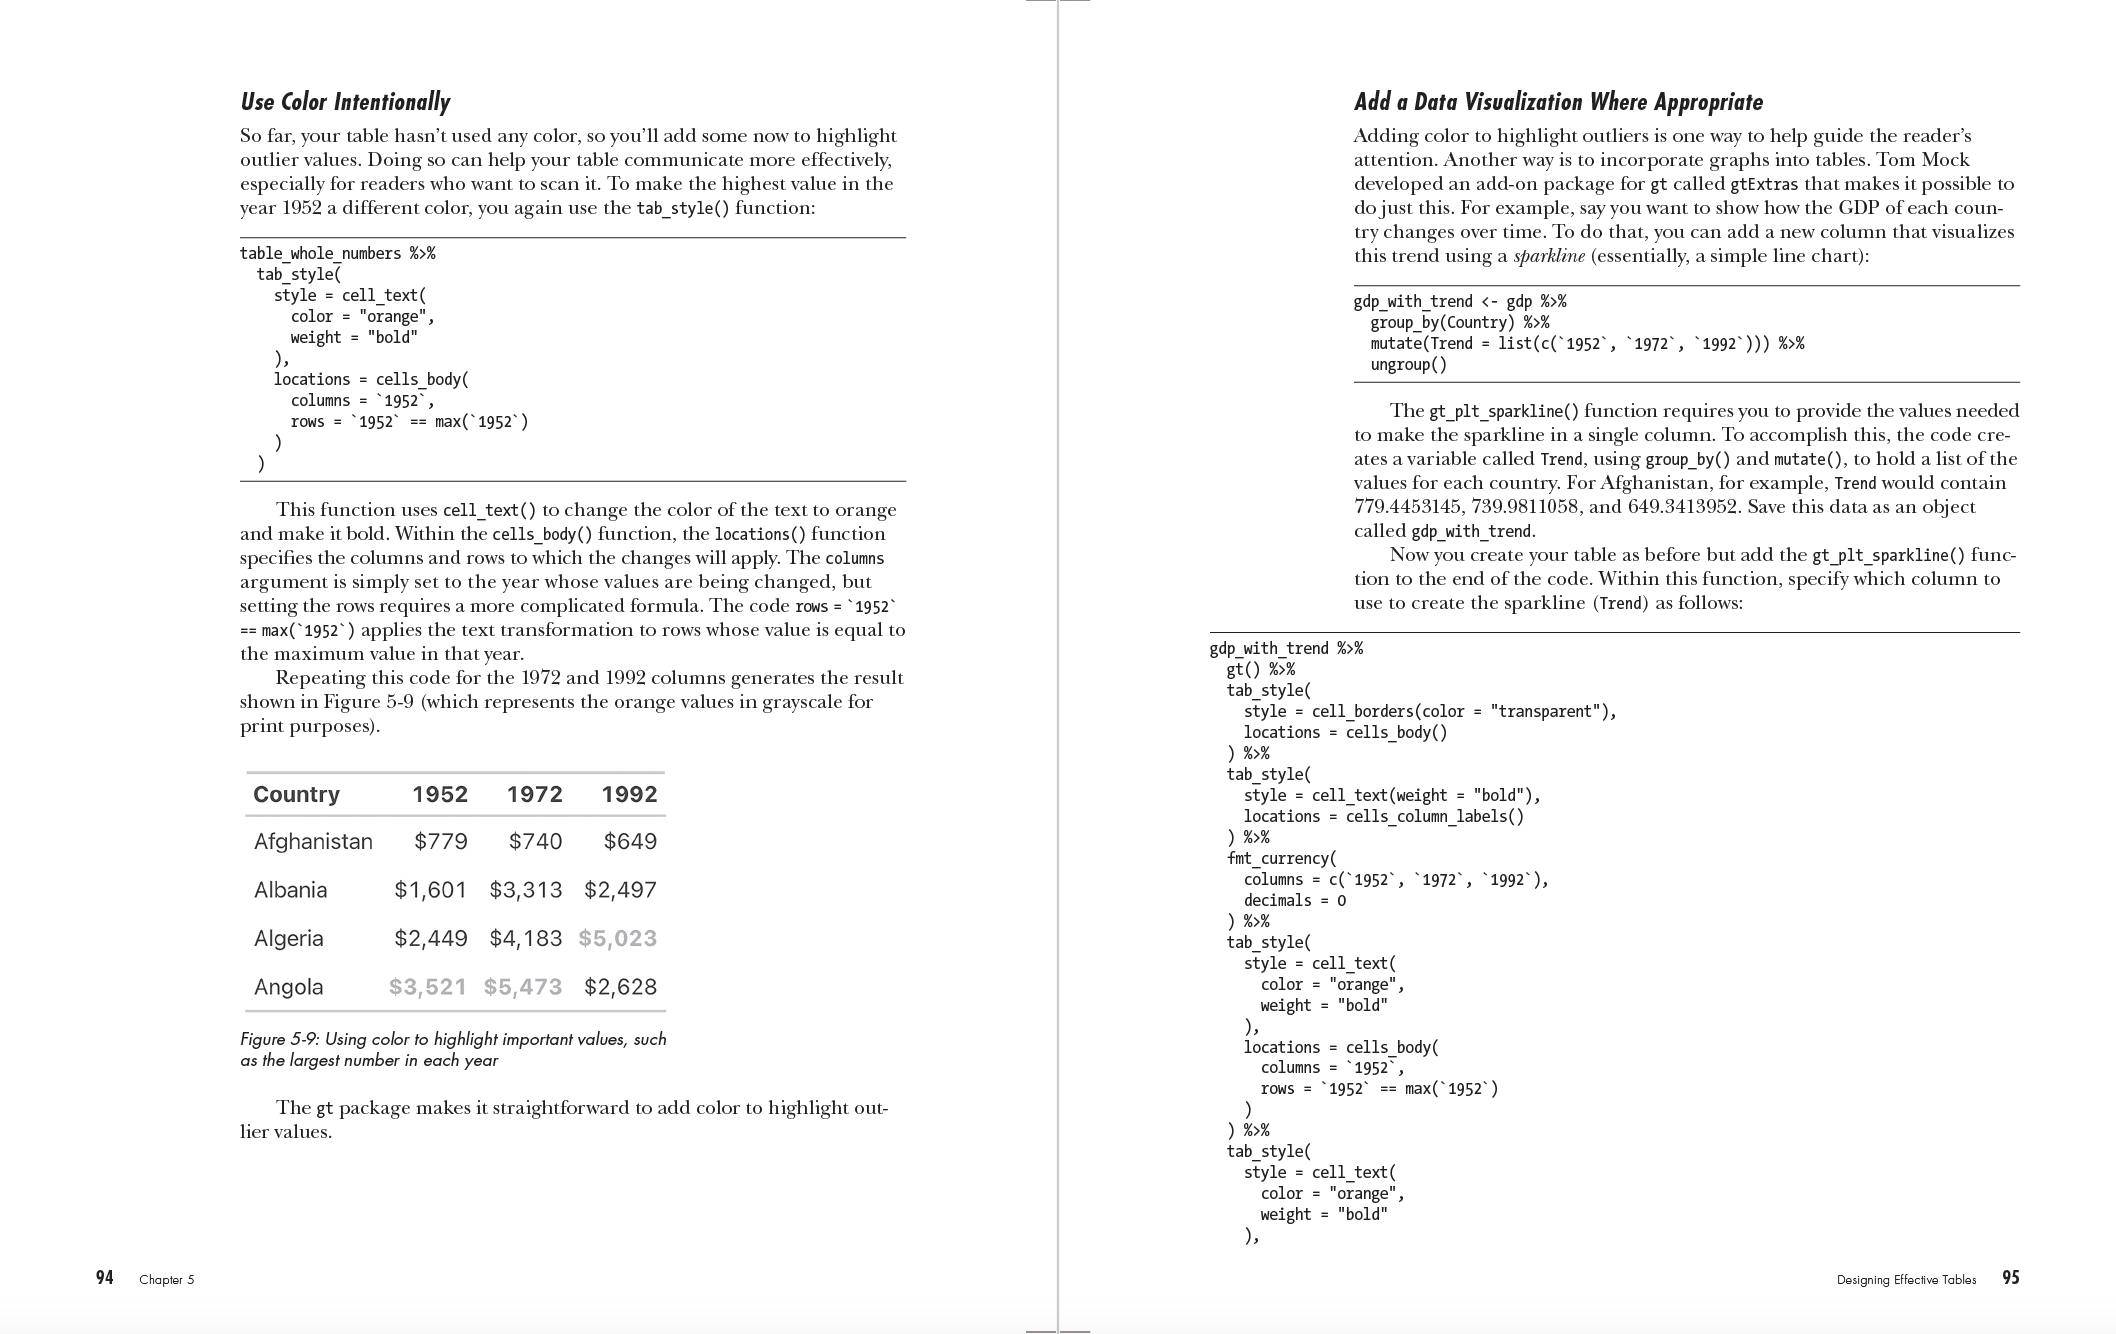
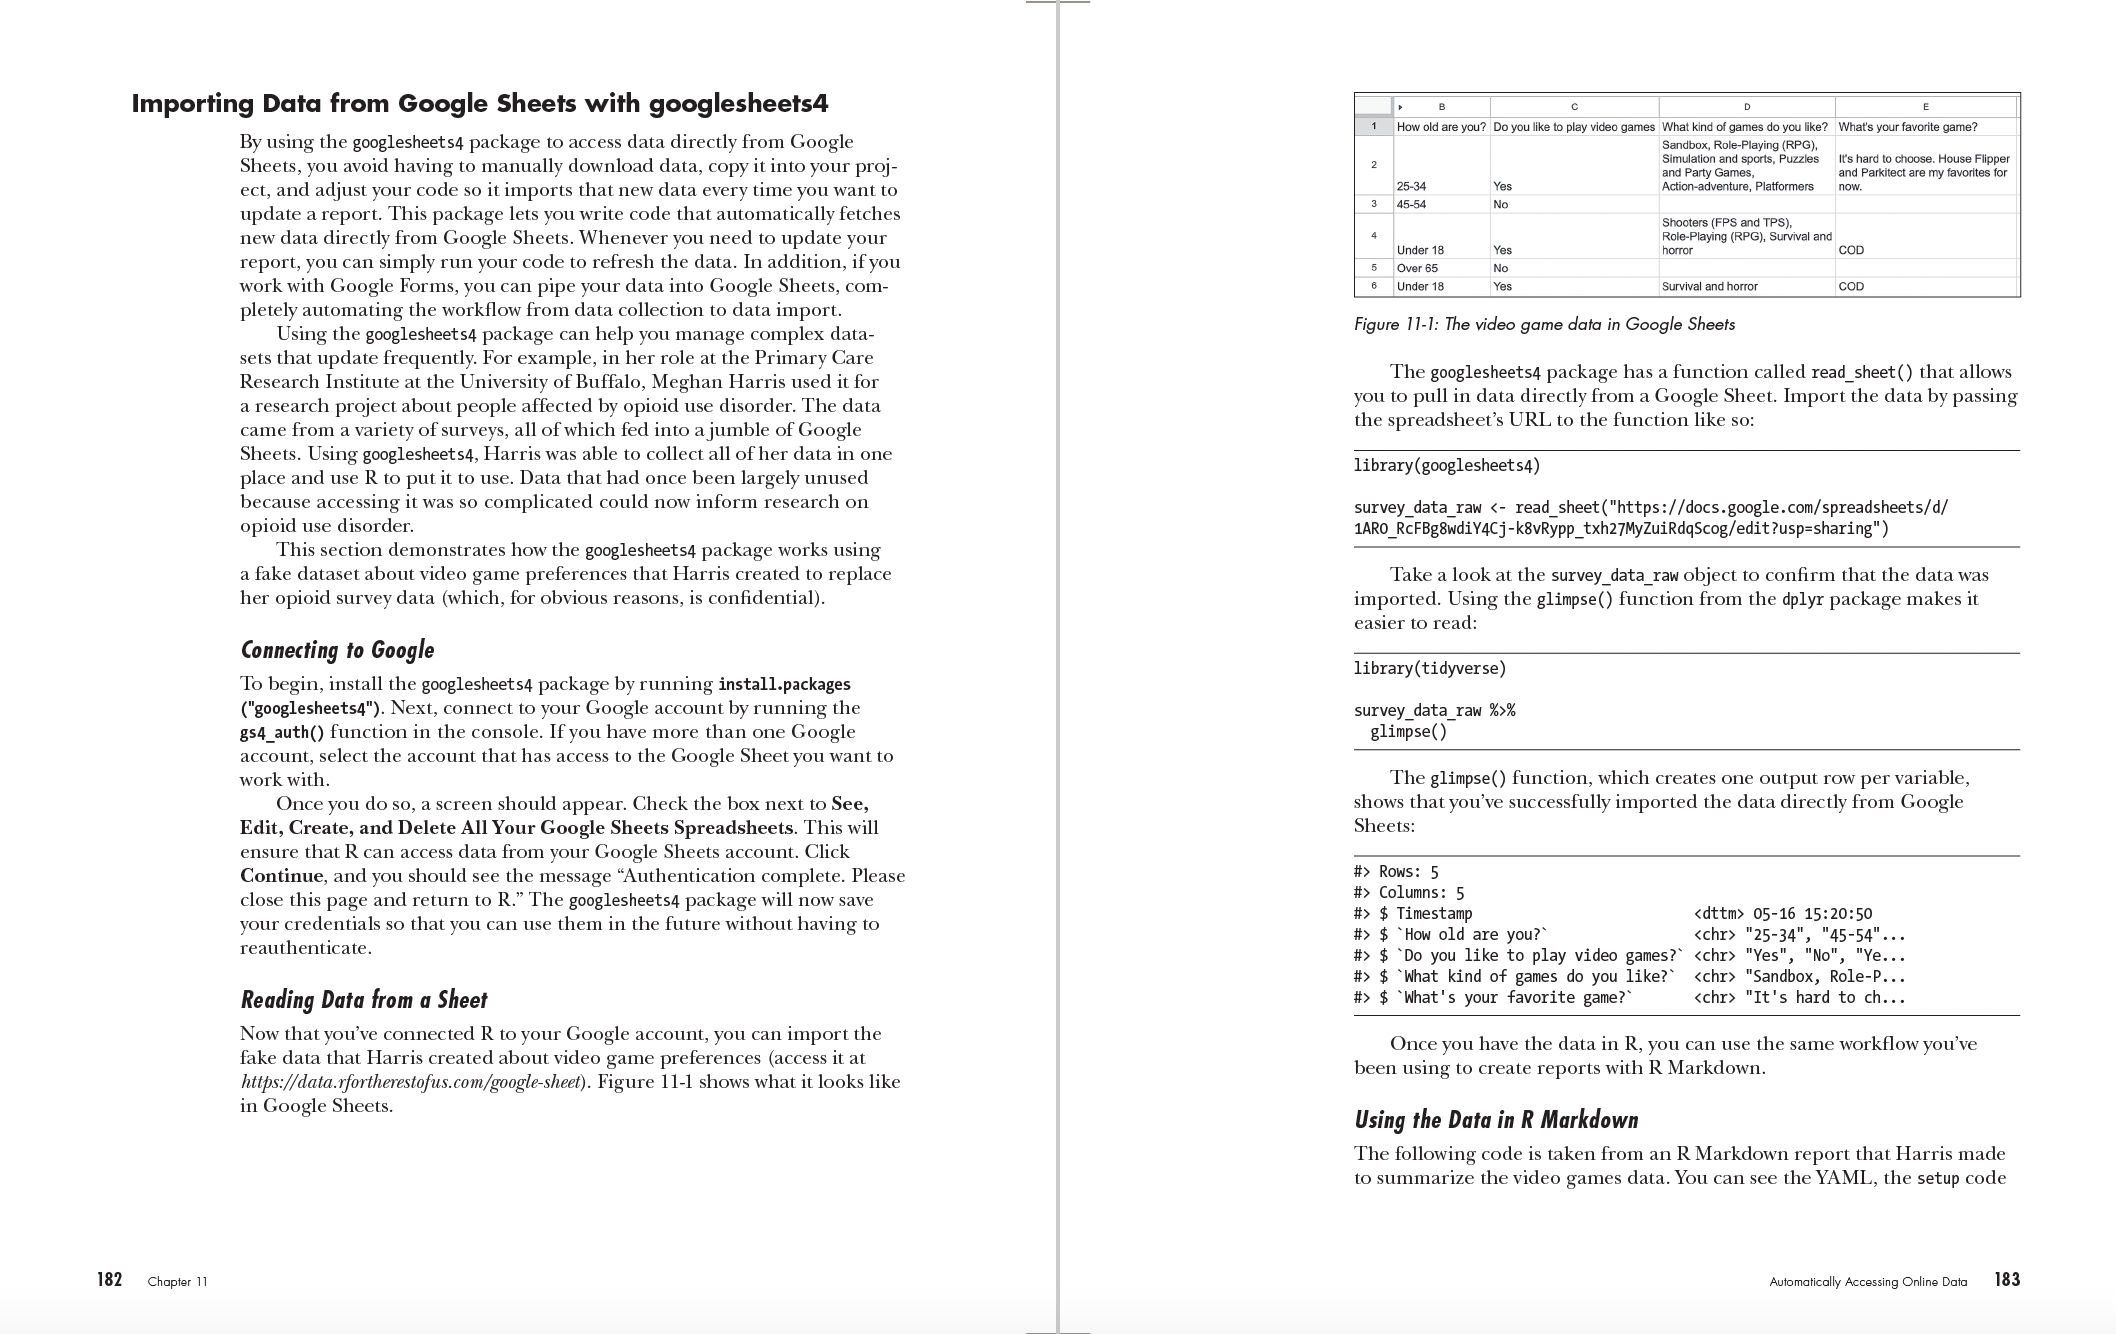
R for the Rest of Us back coverR for the Rest of Us pages 68-69R for the Rest of Us pages 94-95R for the Rest of Us pages 182-183

The R programming language is a remarkably powerful tool for data analysis and visualization, but its steep learning curve can be intimidating for some. If you just want to automate repetitive tasks or visualize your data, without the need for complex math, R for the Rest of Us is for you.

Inside you’ll find a crash course in R, a quick tour of the RStudio programming environment, and a collection of real-world applications that you can put to use right away. You’ll learn how to create informative visualizations, streamline report generation, and develop interactive websites—whether you’re a seasoned R user or have never written a line of R code.

You’ll also learn how to:

• Manipulate, clean, and parse your data with tidyverse packages like dplyr and tidyr to make data science operations more user-friendly

• Create stunning and customized plots, graphs, and charts with ggplot2 to effectively communicate your data insights

• Import geospatial data and write code to produce visually appealing maps automatically

• Generate dynamic reports, presentations, and interactive websites with R Markdown and Quarto that seamlessly integrate code, text, and graphics

• Develop custom functions and packages tailored to your specific needs, allowing you to extend R’s functionality and automate complex tasks

Unlock a treasure trove of techniques to transform the way you work. With R for the Rest of Us, you’ll discover the power of R to get stuff done. No advanced statistics degree required.

Author Bio 

David Keyes is the founder and CEO of R for the Rest of Us (rfortherestofus.com), which offers online courses, workshops, and custom training sessions that help organizations take control of their data. He has a PhD in anthropology from UC San Diego, as well as a master's degree in education from Ohio State, and has dedicated his professional life to teaching people to embrace R as the most powerful tool for data analysis and visualization.

Table of contents 

Introduction
Part I: Visualizations 
Chapter 1. An R Programming Crash Course
Chapter 2. Principles of Data Visualization
Chapter 3. Making Your Own ggplot Theme
Chapter 4. Creating Maps
Chapter 5. Crafting High-Quality Tables
Part II: Reports, Presentations, and Websites
Chapter 6. Writing Reports in R Markdown
Chapter 7. Using Parameters to Automate Reports
Chapter 8. Making Slideshows with xarigan
Chapter 9. Building Websites with distill
Chapter 10. Reproducible Reporting with Quarto
Part III: Automation and Collaboration 
Chapter 11. Accessing Online Data
Chapter 12. Creating Your Own R Packages

View the Copyright page
View the detailed Table of Contents
View the Index

Reviews 

“David Keyes delivers a comprehensive and approachable guide to R programming in R for the Rest of Us. His expertise shines through in every chapter, making complex concepts understandable and applicable. This book is a fantastic and invaluable resource for anyone working with or aspiring to work with data, regardless of their background. Highly recommended.” 
—Gabriela de Queiroz, Director of AI, Microsoft; Founder of R-Ladies and AI Inclusive

“Long overdue in the R ecosystem.” 
—Oscar Baruffa, Big Book of R

“A great resource for anyone wishing to learn R without the intimidating jargon that normally comes with software books.”
—Cara Thompson, Data Visualization Consultant at Building Stories with Data

“David has captured some of the most compelling ways to use R for data visualization and maps, automation, reporting, and building websites.”
—Tom Mock, Product Manager at Posit

“An easy-to-read source of exciting case studies, relevant code snippets, and helpful explanations—no matter if you're an experienced programmer or not.”
—Cédric Scherer, data visualization and information graphics designer

“Demonstrates how succinctly R can be used to rapidly solve non-statistics problems.”
—Bob Rudis , author of Data-Driven Security: Analysis, Visualization and Dashboards and VP of Data Science, Security Research & Detection Engineering at GreyNoise Intelligence